Page 1 of 1
Issue Reproducing EPW Phonon-Assisted Absorption
Posted: Fri Aug 01, 2025 9:45 am
by Agathyan
Dear all,
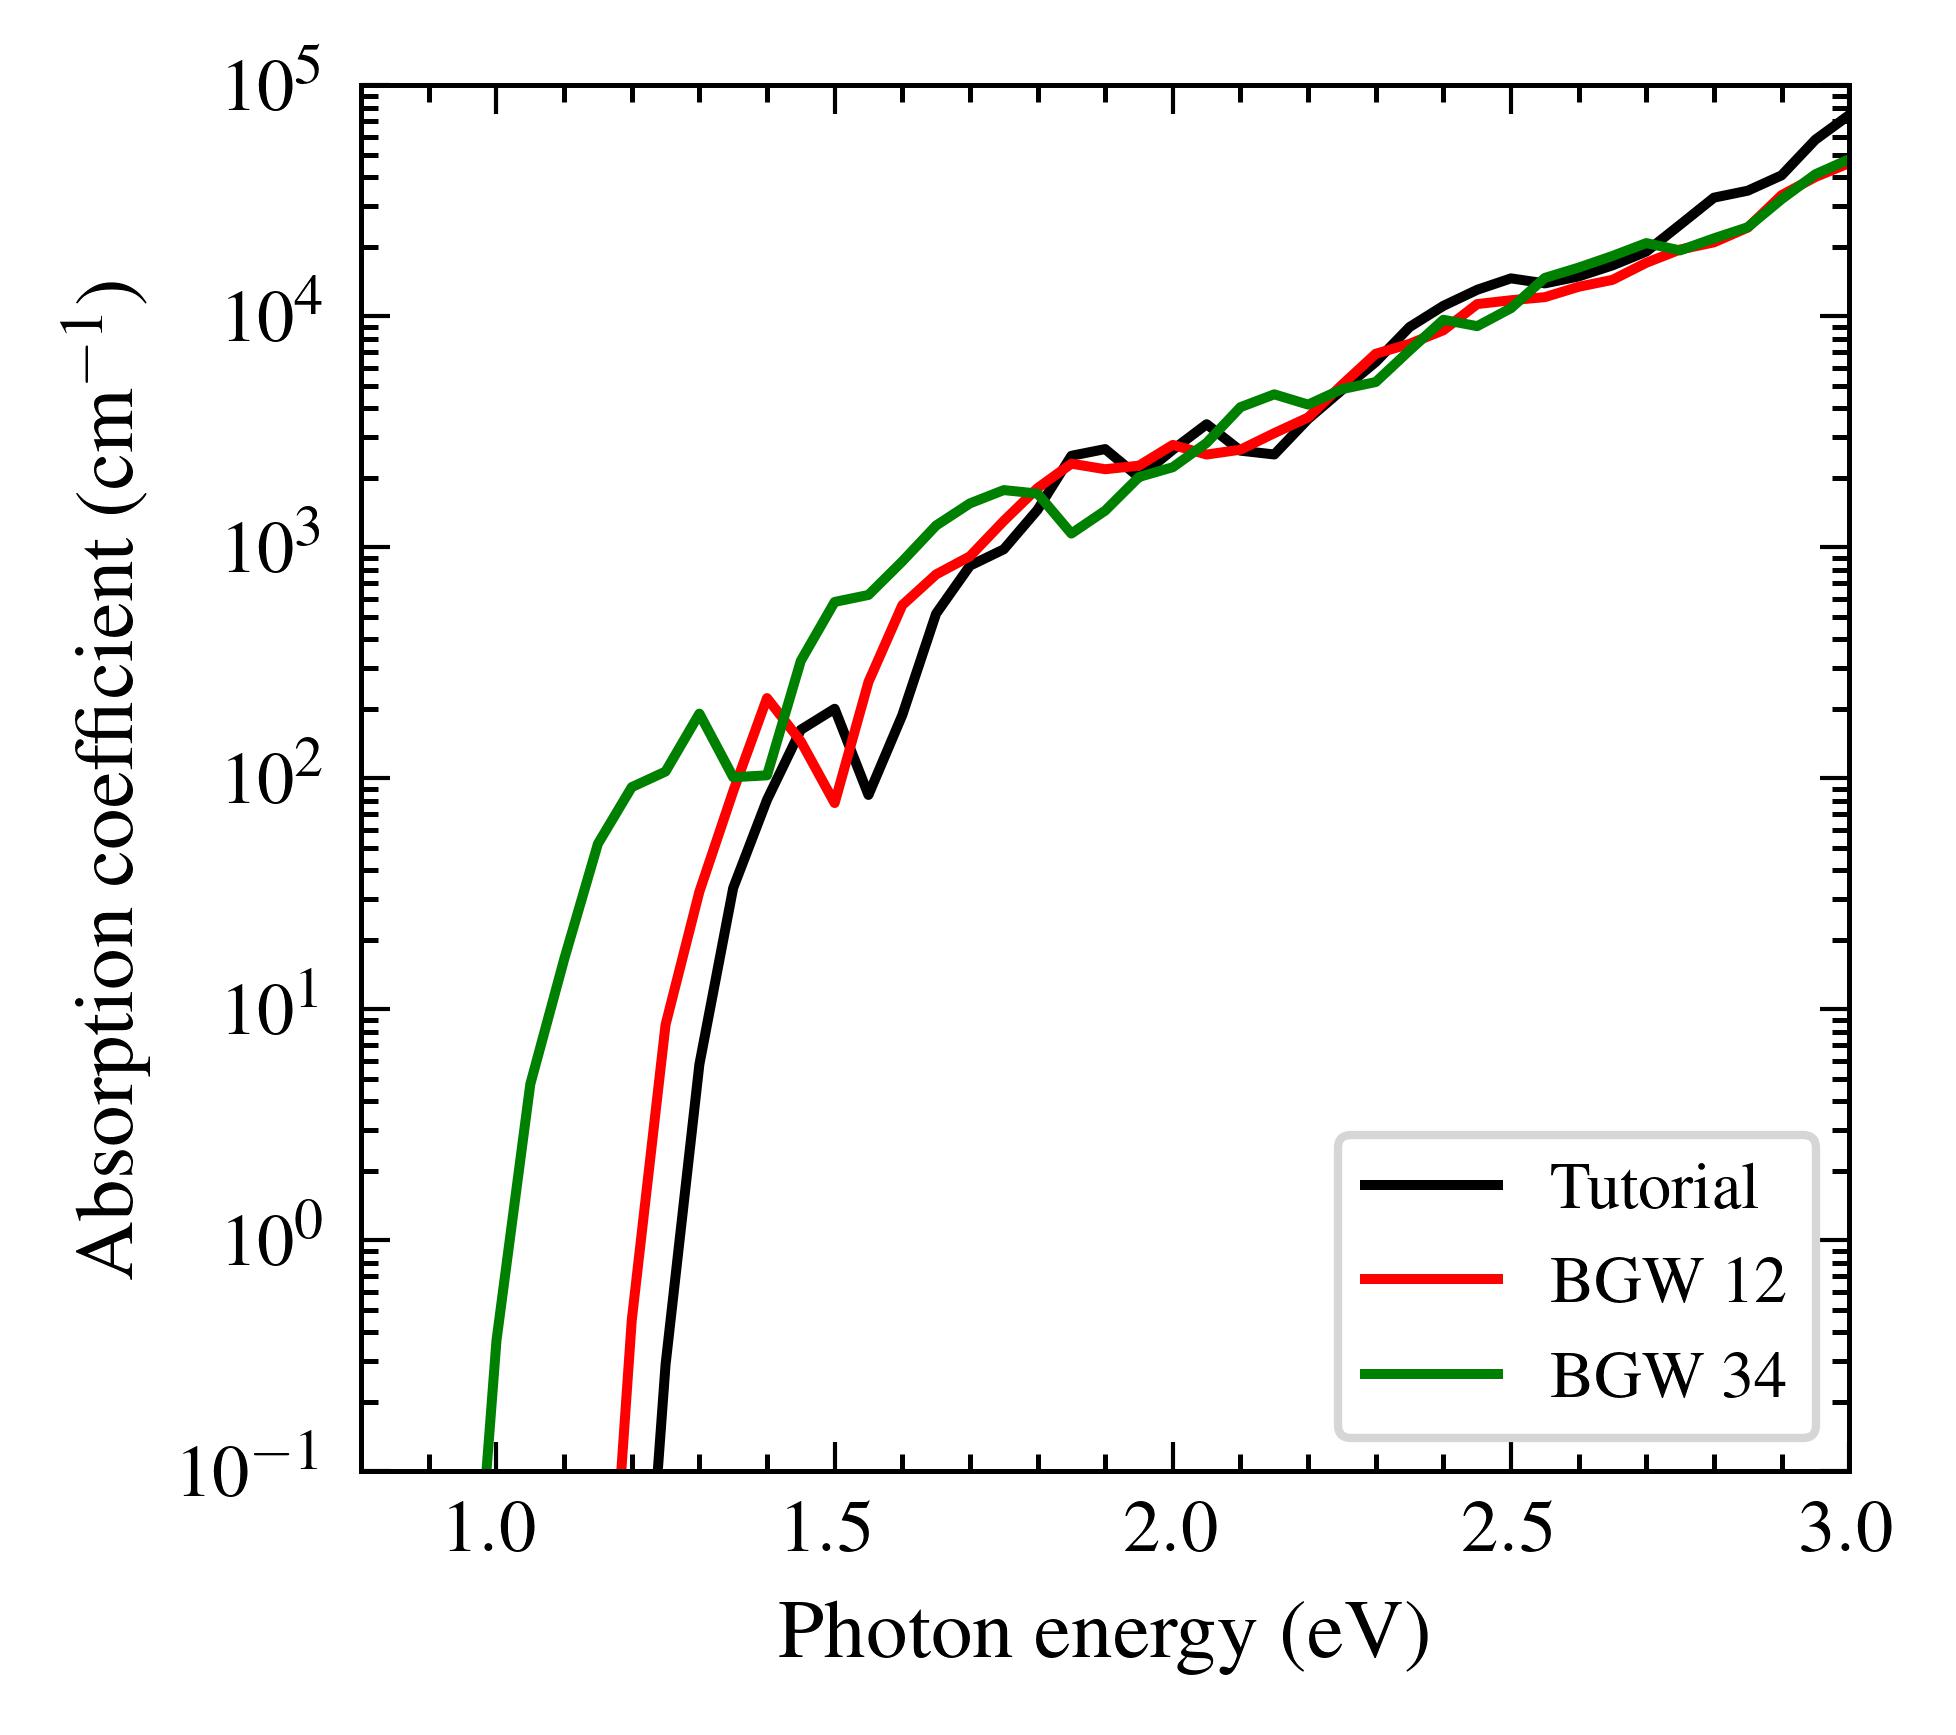
I am attempting to reproduce the EPW 2024 phonon-assisted absorption tutorial. While results match with 12 bands, increasing to 34 bands yields discrepancies. I have attached the input files and comparison plots. I kindly seek guidance on appropriate adjustments or known issues.
Sincerely,
Agathyan
Re: Issue Reproducing EPW Phonon-Assisted Absorption
Posted: Tue Aug 05, 2025 7:53 pm
by xiaozha
Dear Agathyan,
Looking at the plot, a few potential possibilities:
-First, looks very likely that with 12 bands, you are using eig_read = .true. with the provided Quasiparticle energies si.eig. Each block of that file contains quasiparticle energies to correct the DFT gap of each k-point and 12 bands, with blocks separated by line breaks. Naturally, if one try to process that file with 34 bands, it will fail or give incorrect result.
-If this is indeed the case, I would suggest that the correct way to benchmark the result is either to provide a similar eigenvalue file but instead of containing 12 bands per block, it should contain the correct number of bands (34) per block. Alternatively, one can set eig_read = .false. to avoid reading external eigenvalues, and proceed with an arbitrary number of bands. Please make sure to adjust the windows in the Wannierization - as long as the Wannierization is correct, the result should not depend on this setting significantly.
-Other thoughts:
The second plot seems to be not matching the first plot. I don't think EPW can directly convert epsilon_2 to absorption coefficient as of now, but based on the difference in the first plot, I'm probably not expecting that huge of a difference in absorption coefficient(several order of magnitude). This is probably something to double check. A quick test would be assuming a constant refractive index, say for silicon, 3.4, and then the absorption coefficient depends solely on epsilon_2 and photon energy.
Also, the kinks and spikes you see in the spectra is related to underconverged k-points, so they should go away if one converges the spectra further. Typical we see something like 32*32*32 to be enough (this also depends on the gaussian broadening one uses).
Please see if these are helpful?
Thanks!
Xiao
Re: Issue Reproducing EPW Phonon-Assisted Absorption
Posted: Thu Aug 14, 2025 3:21 pm
by Agathyan
Dear Xiao,
Thank you for your detailed feedback and valuable suggestions regarding my EPW calculations.
To address your points and update on my progress:
- Eigenvalue File:I had already used the si.eig file with 34 bands per block (attached in first post)
- Recalculation with Tutorial and Custom Eigenvalues:
- I repeated calculations using the tutorial’s eigenvalues and my BerkeleyGW (BGW) eigenvalues for NBANDS = 12 and NBANDS = 34.
- This time, I made a change in epw2.in, I set fermi_energy = 6.2426 eV (as per my scf.out) instead of the tutorial’s given 5.57 eV.
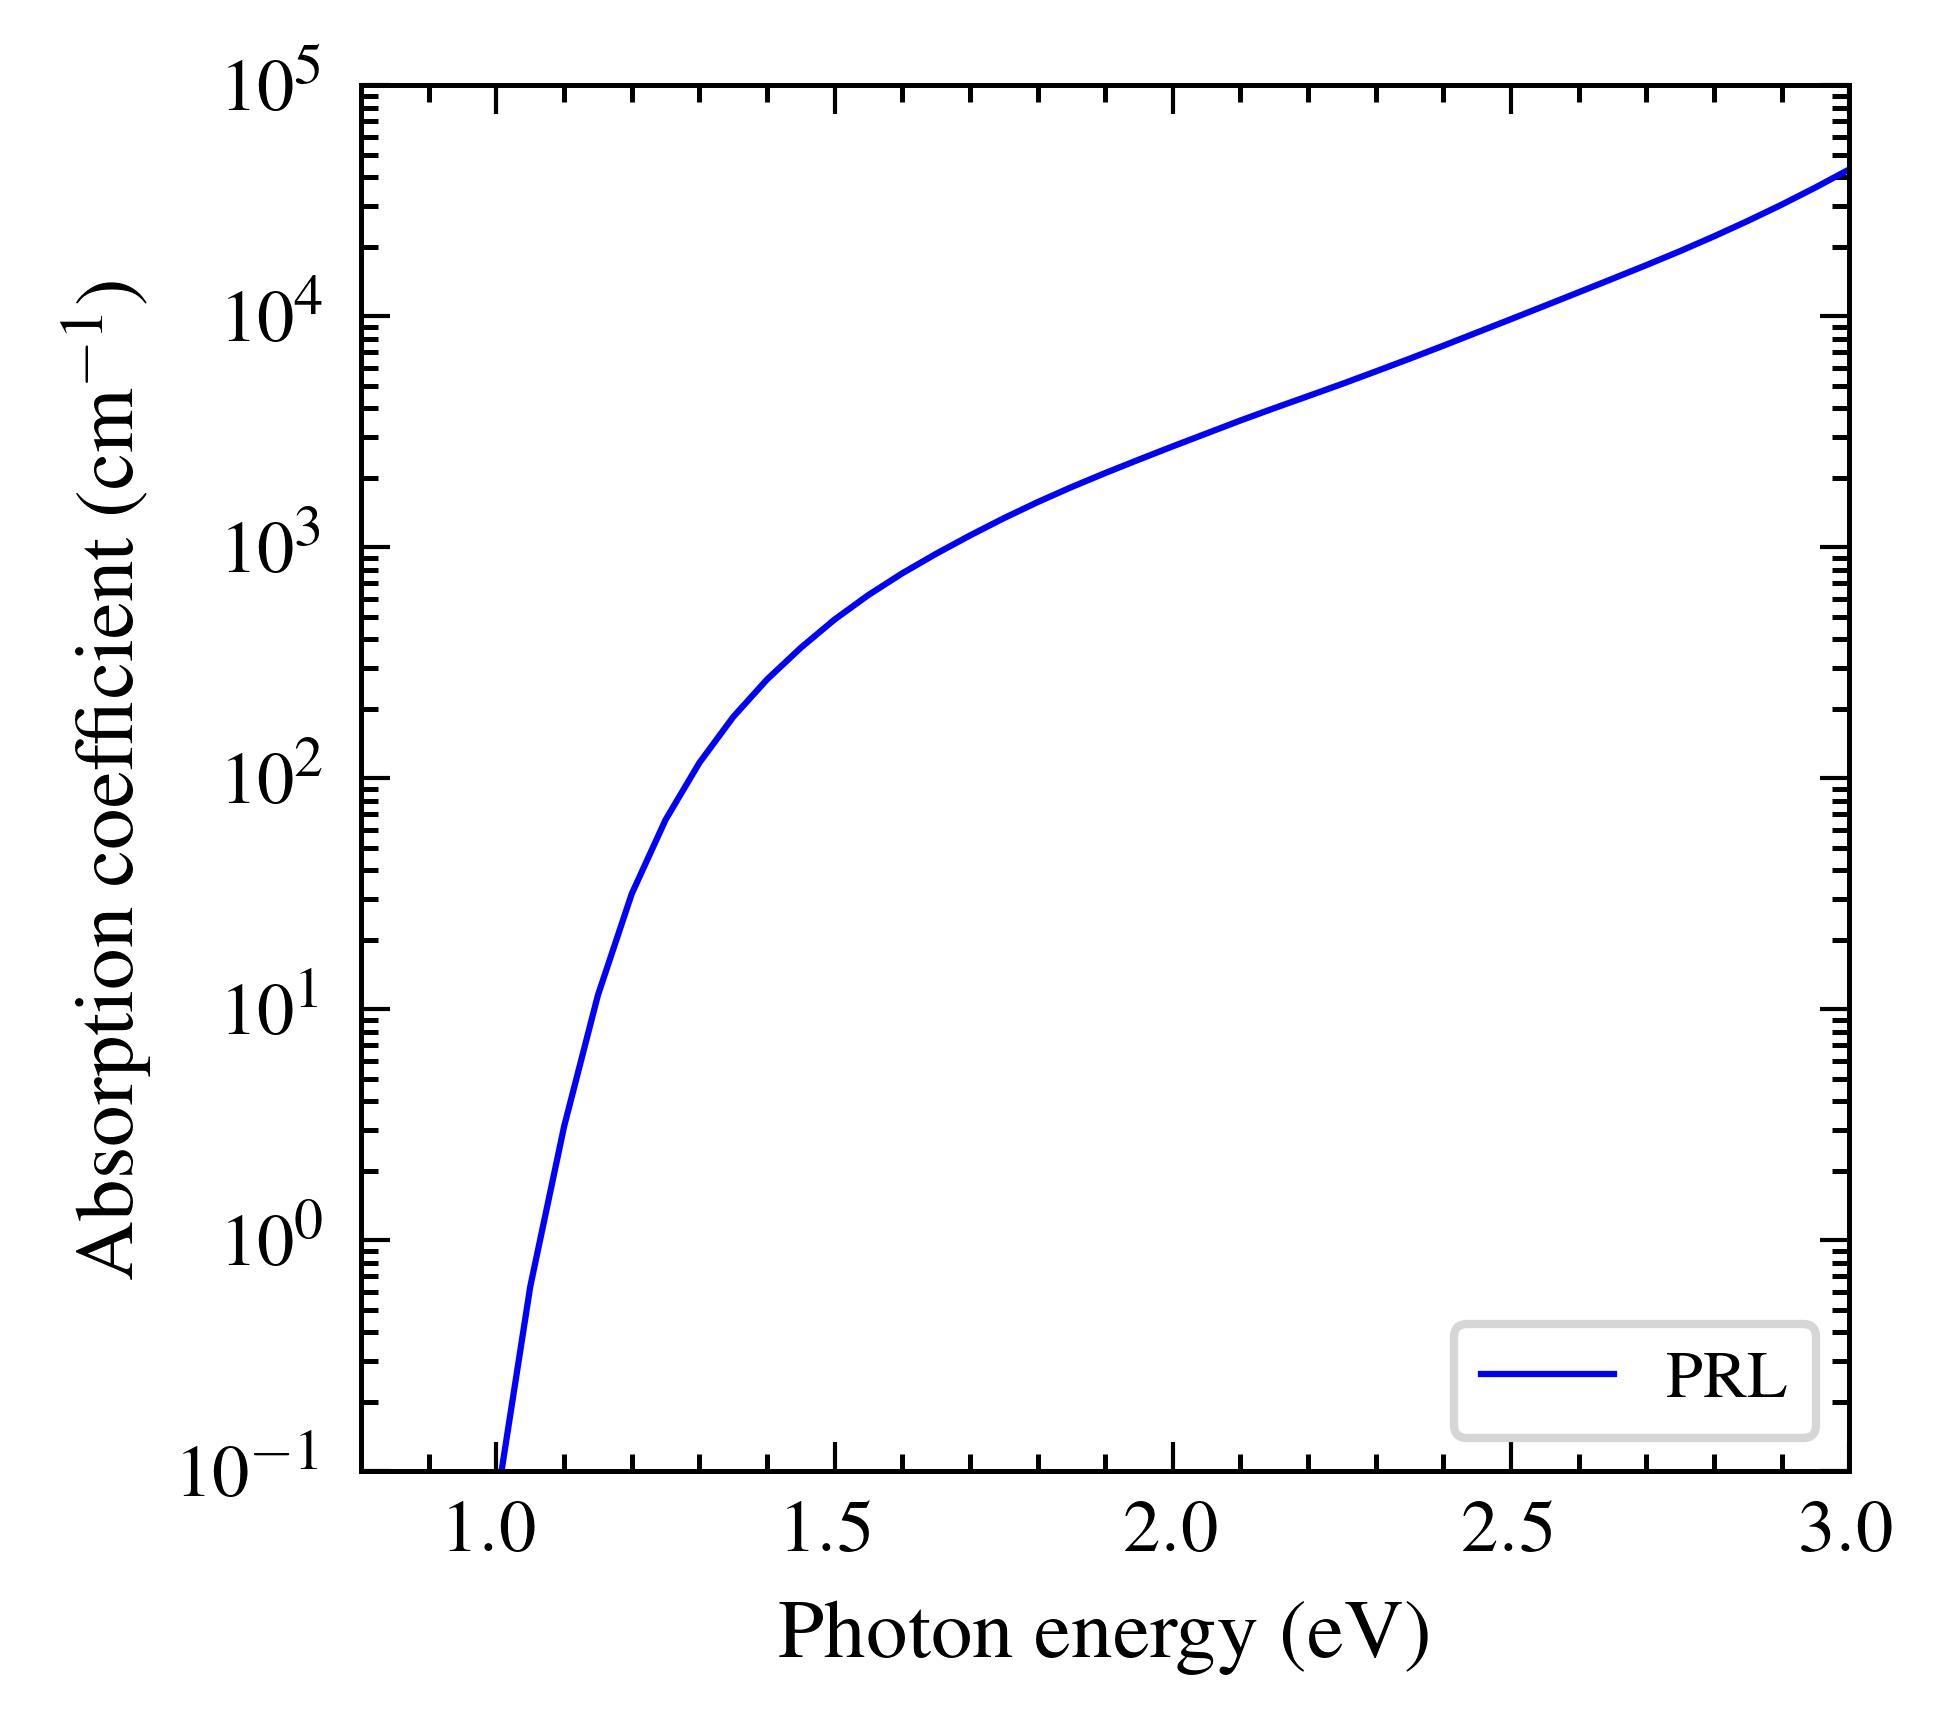
- And I also tried with this PRL paper's convergence parameters (Fig. 3, J. Noffsinger et al., Phys. Rev. Lett. 108, 167402, 2012), and I got a good fit with it.
- Absorption Coefficient Conversion: Since EPW doesn’t convert epsilon_2 to the absorption coefficient, I did that using Python code. For conversion, I initially used the speed of light as 3x10^8 m/s and the refractive index as 1. After noticing the tutorial plot uses cm⁻¹, I switched to 3x10^10 cm/s and 3.4 refractive index (per your suggestion). This nearly matched the magnitude in the Tutorial
Please find attached:
- Absorption Coefficient Results
1. For 12x12x12 Fine K and Q Points

- abscoeff_indabs_eig_comp.jpg (181.12 KiB) Viewed 35389 times
2. For 48x48x48 Fine K and Q Points

- abscoeff_indabs_eig_prl_comp.jpg (144.39 KiB) Viewed 35389 times
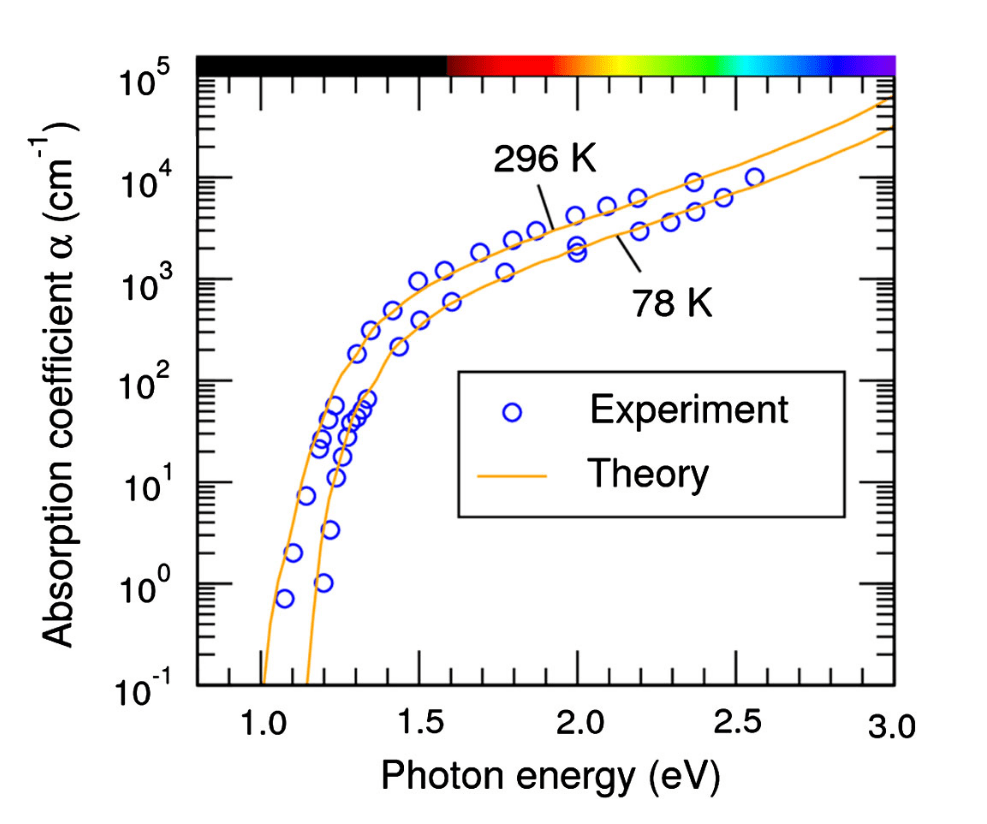
- Tutorial plot for reference

- Screenshot from 2025-08-14 09-57-36-min.png (92.4 KiB) Viewed 35389 times
Re: Issue Reproducing EPW Phonon-Assisted Absorption
Posted: Thu Aug 14, 2025 7:00 pm
by xiaozha
Dear Agathyan,
Thanks for updating! Just by eyeballing your absorption coefficient indeed seems quite close to the converged values in the PRL. If you used two different set of GW eigenvalues from two different GW calculations (12 bands and 34 bands) with different settings, naturally that difference would matter. If you want to see the difference, one thing that you could do is plot the band structure resulted from the two eigenvalues, and you may see a difference in the band gap. In this case one do want to make sure that the GW calculation itself is properly converged (which the tutorial si.eig file may not be).
I think your calculation seems fine. I'm slightly confused by the difference between black and red in the first plot, but if you used the tutorial .eig file in black, and your own .eig file in red, and they just both contain 12 bands, then I think the difference again is from the eigenvalues themselves (i.e. the GW calculations).
Just one note regarding fermi_energy: To evaluate cross gap absorption, as long as the Fermi energy is set to somewhere mid-gap, it is usually fine. The thing to remember though is that when reading the external eigenvalue, it should be set according to the energies of the external eigenvalues, not the scf output.
Thanks!
Best!
Xiao