Hi,
I am trying to calculate the electron phonon coupling matrix between an electron at the cbm and acoustic phonons with a vector that has a fixed magnitude (q) while varying the polar and azimuthal angles (θ,φ) between 0 and π and 0 and 2π respectively. Essentially calculating the electron phonon coupling matrix on the surface of a sphere centred on the cbm with radius q. For FCC crystals like diamond and Si I would expect that for a fixed polar angle, varying the azimuthal angle would give values from the ep matrix 4 fold rotational symmetry as you sweep through the angle from 0 to 2π, however when I run the calculation for silicon this is not the case. Attached are two graphs that show this for q = 0.01, θ=3π/10 and q=0.01, θ=π/2. The full set of input and output files were too large to attach here so can be found at https://www.dropbox.com/scl/fo/ok8t2t1ruhv8bxwcm4chm/AGC1DWP_j2IOz2M-btfYiDI?rlkey=o5ov3fdih9tsjdrmgr8e0r18x&st=bih189sj&dl=0.
The phonon frequencies calculated along the same path show the expected symmetry and I see this symmetry in the phonon frequencies and electron-phonon coupling matrix when I run this calculation for diamond.
Please could someone help me work out what the problem is so that I can better understand what is happening for future calculations.
Patrick
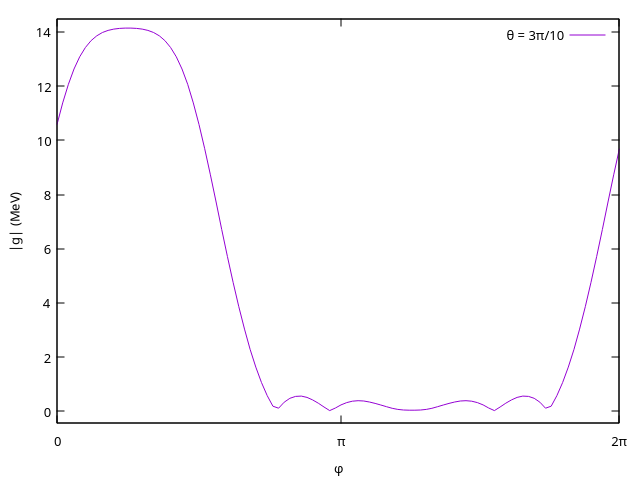
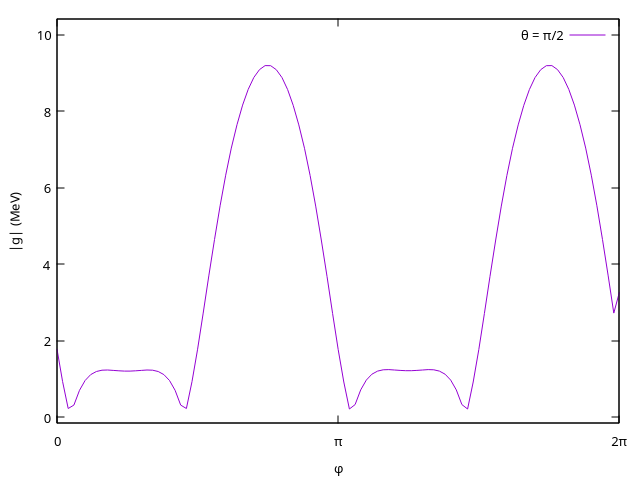
Hello Patrick,
I took a quick look at your inputs.
The Wannier functions are quite nice and symmetric so it should be fine (si.wout).
I think that the problem is your k-point. You are fixing k=0,0,84 in v_min.dat
For the symmetry to hold, you must be exactly (to many digits) at the CBM and look at that band index only. I am assuming that you are not exactly at the minimum.
I would suggest that you first try this at the k=0,0,0 (Gamma point) and look the VBM bands. There it should hold. Can you confirm this ?
Also, from looking at your q-path (path_aco.dat), I do not fully get it. It seems the first 100 values or so are the same (0,0,0.01) ?
Hope this helps,
Samuel
Hi Samuel,
Thank you for the advice, I am sorry it has taken me so long to respond to this.
I have run EPW for Si at the VBM and extracted the electron-phonon coupling for the acoustic phonon bands using
grep “4 4 i” epw_aco.out where i=1,2,3 and taking the eighth column |g| (MeV).
This still does not show the symmetry I would expect based on the q-path I have used.
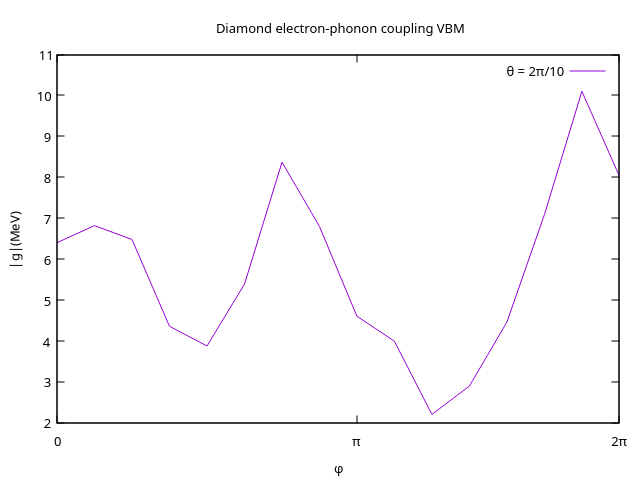
I have also run EPW for diamond at the CBM which shows reasonably good symmetry even with fewer points in the q-path and a coarser k-mesh in the nscf calculation.
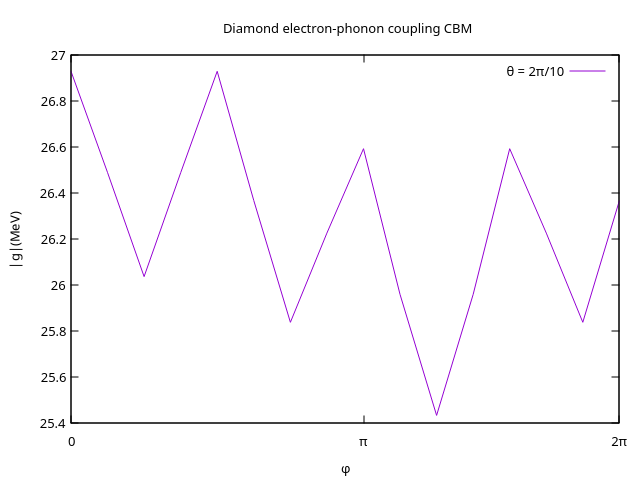
However, using exactly the same inpu files but moving the k-point in v_min.dat to the Gamma point (k=0,0,0) doesn’t show the expected symmetry.
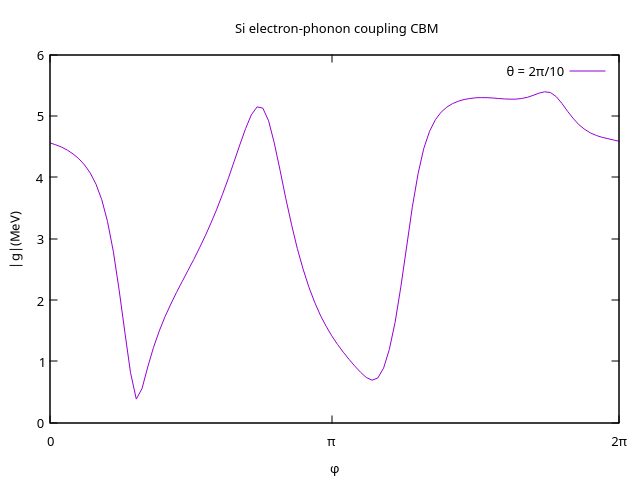
Am I just misunderstanding what the output is giving or is the radius of the sphere on which the q-path is drawn just too small resulting in mixing of the bands?
Data used to generate these plots can be found at https://www.dropbox.com/scl/fo/wioo8p8asfoazgvkohvjl/AF6SIYoXtpr6xTxrOnoTXYQ?rlkey=5au68djgebjvkyvwodc2epdb1&st=5j67csk4&dl=0
Any insight would be helpful as I am unsure of how to proceed.
Cheers,
Patrick